Key Components of a BI System Audit
1. Data Sources and Integration
The foundation of effective BI reporting lies in the data sources. An audit must evaluate the variety, reliability, and quality of data sources feeding into these reporting tools. This evaluation includes assessing the methods of data integration - are the data sources seamlessly and accurately integrated into the BI reporting system? This ensures the BI reports generated are reflective of the complete data landscape.
2. Data Quality
Data quality is necessary for the accuracy and reliability of BI reports. An audit should scrutinize the data quality in terms of accuracy, timeliness, completeness, and consistency. High-quality data leads to credible Business Intelligence reports, which are essential for informed decision-making. The audit must include a review of data cleansing, validation processes, and anomaly detection mechanisms within BI reporting tools.
Key Points for Data Quality Assessment in BI Reporting
1. Accuracy Assessment:
- Is the data accurately reflecting real-world scenarios?
- Are there any errors or outdated elements in the reports?
2. Completeness Check:
- Are there gaps in the data used for reporting?
- What are the potential reasons for any incomplete data?
3. Consistency Evaluation:
- Is the data consistently formatted across different BI reports and tools?
- How well does the data align across various systems?
4. Reliability of Data Sources:
- How trustworthy are the data sources feeding into the BI reporting tools?
- Are these sources regularly validated for reliability?
5. Implementation of Data Quality Scorecards:
- Are data quality scorecards and metrics in place to measure and track data quality?
- How are these scorecards tailored to the specific needs of reporting?
6. Data Profiling and Cleansing Processes:
- Has data profiling been conducted to uncover inconsistencies or anomalies?
- What processes are in place for data cleansing to improve the quality of these reports?
7. Impact of Poor Data Quality:
- What are the potential consequences of poor data quality on BI reporting and decision-making?
- How can these impacts be mitigated or avoided?
8. Continuous Monitoring and Improvement:
- Are there mechanisms for ongoing monitoring and improvement of data quality?
- How is the organization adapting to changes in data sources and BI reporting needs?
These points can serve as a checklist or guide for professionals looking to ensure high data quality in their BI reporting processes.
3. BI Reporting Tools Evaluation
The audit must thoroughly assess the BI reporting tools employed in the organization. This involves evaluating the tool's ability to meet current and future business requirements, its ease of use, scalability, and performance. The effectiveness of these tools directly impacts the quality and utility of the Business Intelligence reports produced. The functional capabilities checklist for evaluating BI reporting tools:
1. Data Processing and Analysis
- Can the tool efficiently handle large volumes of data for BI reporting?
- Does it support complex analyses required for sophisticated BI reports?
2. Data Visualization and Report Generation
- Assess the variety and quality of data visualization options.
- Check the ease of generating and customizing Business Intelligence reports.
3. Integration with Data Sources
- Does the tool integrate smoothly with various data sources?
- Evaluate its capability to handle both structured and unstructured data.
4. Audit and Control Capabilities
- Does the tool offer robust audit trails for BI reporting?
- Evaluate the ease of tracking changes and managing access to reports.
5. Technical Support and Training
- Check the availability and quality of technical support.
- Look for training resources to help users maximize the tool's potential.
4. User Satisfaction and Accessibility
An often overlooked aspect is the user experience with BI reporting tools and reports. The audit should involve feedback from end-users about their experience and satisfaction with the BI reports they receive. Are the reports accessible, understandable, and actionable for the intended audience? User satisfaction is a critical measure of the success of BI reporting practices.
1. Ease of Use and User Interface
- Is the tool user-friendly for both technical and non-technical users?
- Assess the intuitiveness of the user interface for efficient BI reporting.
2. Customization and Flexibility
- Check for customization options specific to your BI reporting needs.
- Evaluate the tool's flexibility to adapt to different business scenarios.
3. User Community and Feedback
- Is there an active user community for the tool?
- Assess how the tool developers respond to user feedback and enhancement requests.
5. Compliance, Security, and Privacy
In today's data-centric world, compliance, security, and privacy are crucial. The audit must examine how BI reporting tools and processes adhere to relevant laws and regulations. Are the reports generated compliant with data protection laws like GDPR? How secure is the data within the BI system against breaches or unauthorized access?
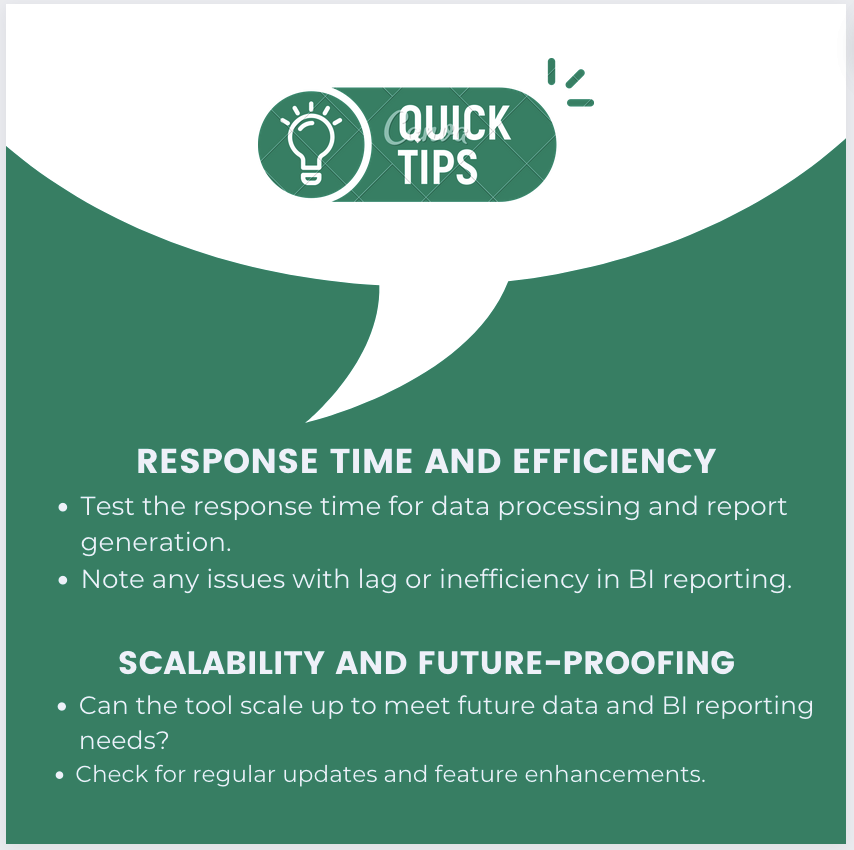
6. Performance and Scalability
The performance of BI reporting tools and the scalability of the BI system are vital. The audit should measure how quickly and efficiently the BI tools process data and generate reports. Can the system scale to meet growing data demands? Performance and scalability directly affect the timeliness and usefulness of Business Intelligence reports.
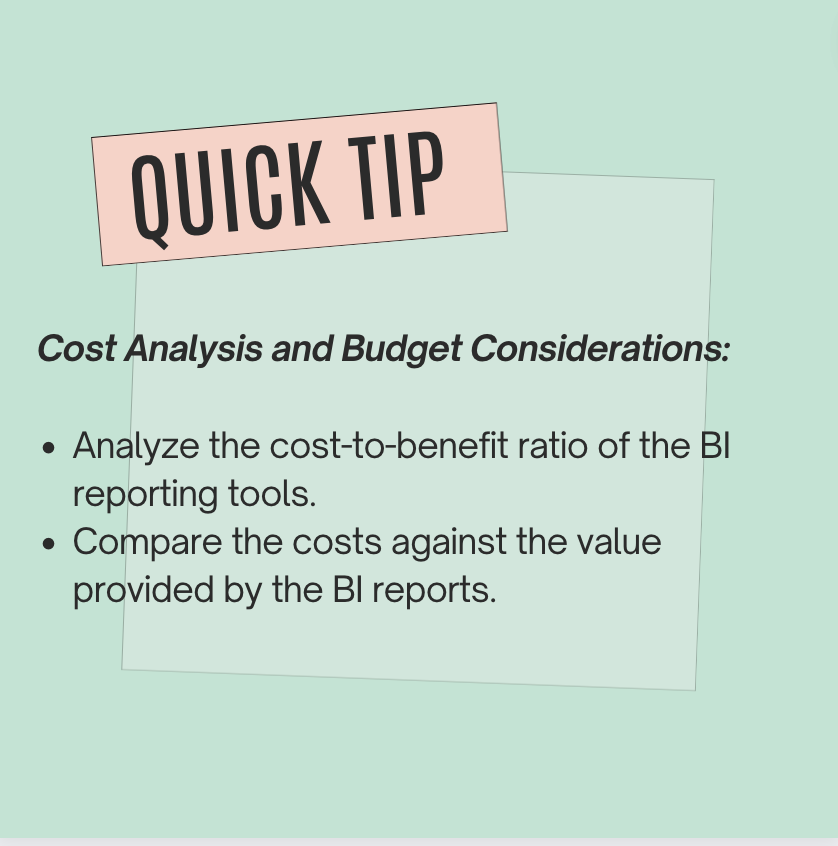
7. Return on Investment (ROI)
Lastly, the audit should evaluate the ROI of the BI reporting system. This involves analyzing the cost of the BI system against the benefits it provides through the reports. Are the insights gained from Business Intelligence reports translating into tangible business value? This evaluation helps in understanding the effectiveness of the BI reporting system in the broader context of business objectives.
Conclusion
Auditing your BI reporting system is much more than a routine check; it's a strategic move to elevate your business intelligence capabilities. A thorough audit, encompassing data quality, tool performance, and ROI analysis, is pivotal in this digital age.
Tools like the Grow BI dashboard shine in this part, offering comprehensive data analysis, customizable metrics, and insightful dashboards. Grow's unique approach to ROI calculation - prioritizing strategic business improvements alongside cost savings - mirrors the depth and foresight needed in today's BI reporting systems.
To see the impact Grow can have on businesses like yours, explore the insights from real users on ‘Grow.com Reviews & Product Details G2’ or enroll in our 14-day free Grow trial now.


