How To Set Up A SMART KPI System?
For a marketing company, a simple but SMART KPI would be able to increase the number of followers by at least 30% every month.
But what is KPI dashboard to anyone using a dashboard?
Let’s take an example.
- Did we get 4,000 new subscribers to our YouTube channel at the end of the month?
- This year, did we make 45% more money than last year?
These are some easier questions like “Did you achieve that particular goal?”, “How did you perform compared to when you started?” and at last, “What did you learn from it?”
It’s easy to spot the difference between the two.
To understand SMART KPIs better, read here.
SETTING UP SMART KPIs
1. Think about business goals in general.
Setting specific, challenging goals leads to a 90% better chance of success.
- “The production team will have a basic product ready by March. Start trials on at least 100 users by mid-march.”
- “We'll launch the product in May”
The above sentence is definitely better as it sheds more light on your goals step-by-step.
There's a good chance that your goals will involve more than one area or department. Sitting down with different stakeholders and talking about these goals will help you narrow down strategies and choose the right things to measure.
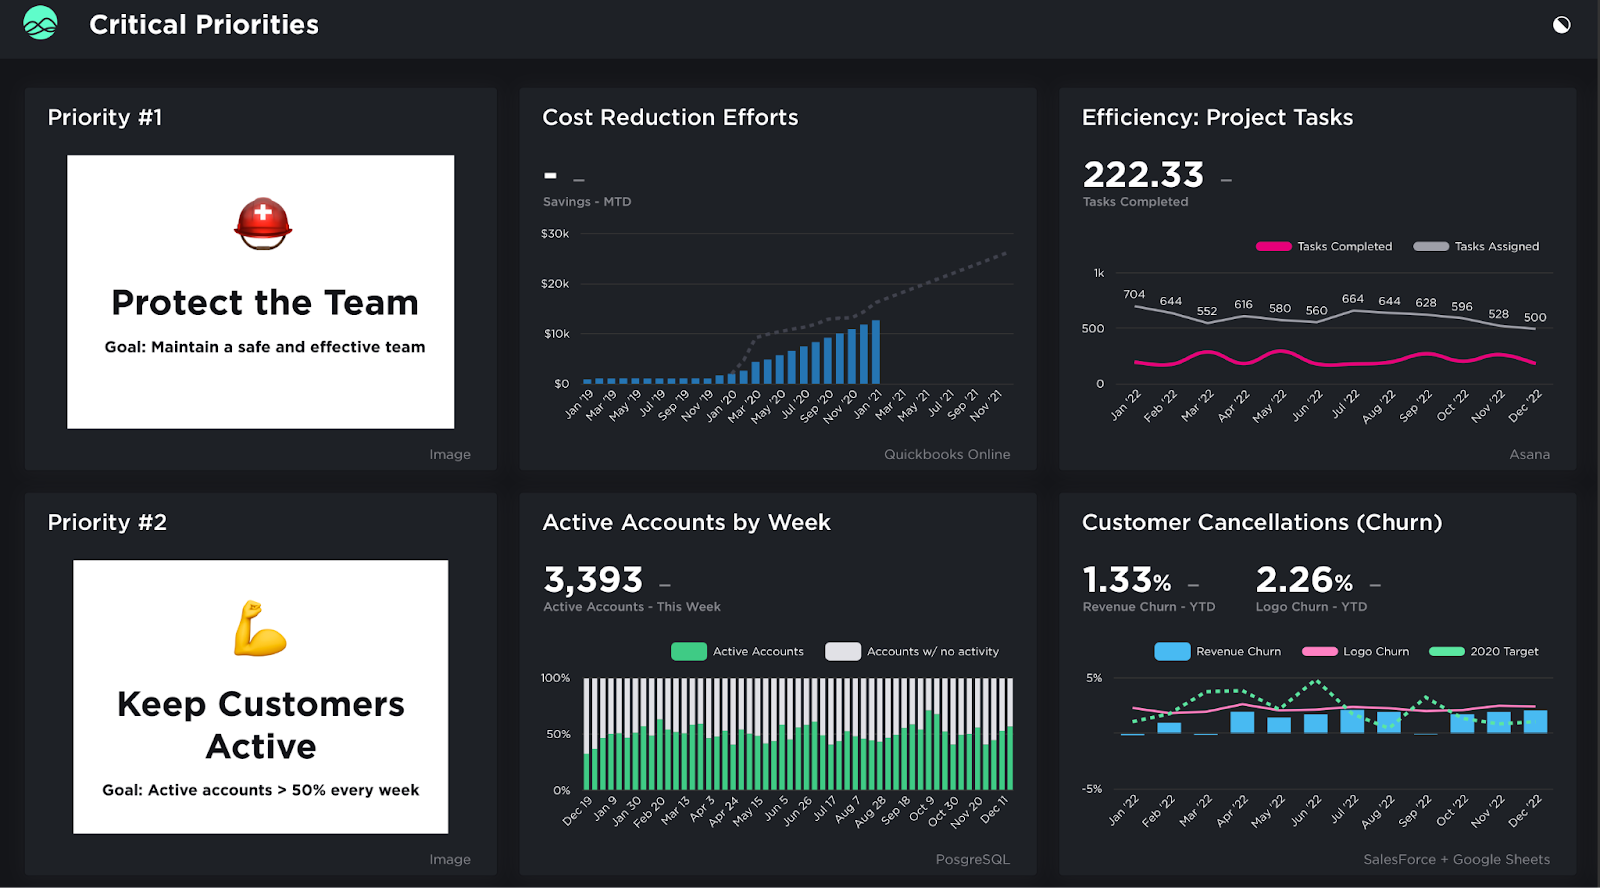
Grow’s Critical Priorities dashboard helps plan your goals and priorities better, leading to higher performance.
2. Use tools to bring your KPIs together.
Putting everything together for analysis is one of the most challenging parts of building one of these systems. This is made possible by SMART KPI dashboard tools that give you a centralized view of all your most important KPIs so you can make decisions based on the whole picture.
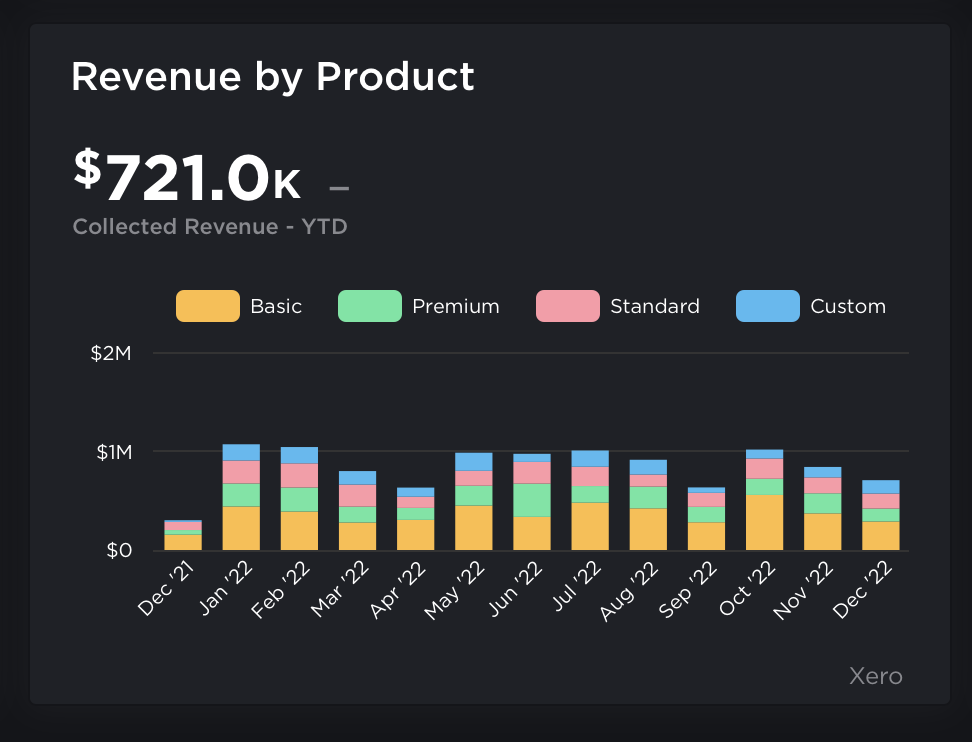
For example, if you want to compare product performance as per revenue every month for a period of a year, you will need to keep an eye on how much the revenue fluctuates compared to the set benchmarks. This makes it easy to see if you are getting the desired results.
Grow’s KPI dashboard is useful not only because it puts all goals in one place but also because it is easy to understand at a glance. Different colors show how likely a goal will be met over that year, making it easy to see where each initiative stands.
3. Make sure people can get to it and work together.
Figures show that team coordination and workplace collaboration can individually improve sales by up to 27%.
When dealing with necessary KPI data, it's essential to work together. Your business goals involve a lot of different departments that need to work together to develop strategies that fit the company vision. With traditional ways of communicating, like Excel sheets or PowerPoint presentations, that doesn't change; it’s hard to talk about accessibility and collaboration because these tools don't change.
Still, a well-thought-out system should be based on working together. Users can easily share their KPI metrics from any device with an internet connection thanks to the online reporting software that has been made. Access to data in real-time is made possible because these tools are used online.
4. Check KPI progress and make changes
A KPIs system needs to be constantly evaluated, just like any other analytical process, to ensure it is doing what is expected. Check your KPI metrics often and be ready to make changes when necessary to keep everything running smoothly.
You don't want to discover in year four that you won't reach your 5-year goal.
To do this, you need to keep a collaborative environment, meet with your team and any other relevant stakeholders, and talk about the status of your strategy regularly. Businesses can get all the benefits of their work by combining the power of people with the power of data.
Grow with their all-powerful KPI dashboards doesn't require you to communicate these KPIs to different departments in your organization. Instead, it offers actionable insights with its highly interactive dashboards.
Closing Words-
Are you stuck in a cycle of repeatedly making reports? This cheat sheet will show you how to make the most suitable KPI report, giving you multiple insights from a single dataset and getting you out of the cycle.
When you set SMART goals, it's easy to see your key performance indicators. With Grow's KPI dashboard, you can not only measure performance across departments, but you can also:
- Make sure everyone is following the plan and working toward the same goal,
- Keep track of your project's progress by getting updates from your team members.
- At the council, board, and shareholder meetings, give an unbiased report on how your strategic goals are coming along.


