What is Self-Service BI Reporting?
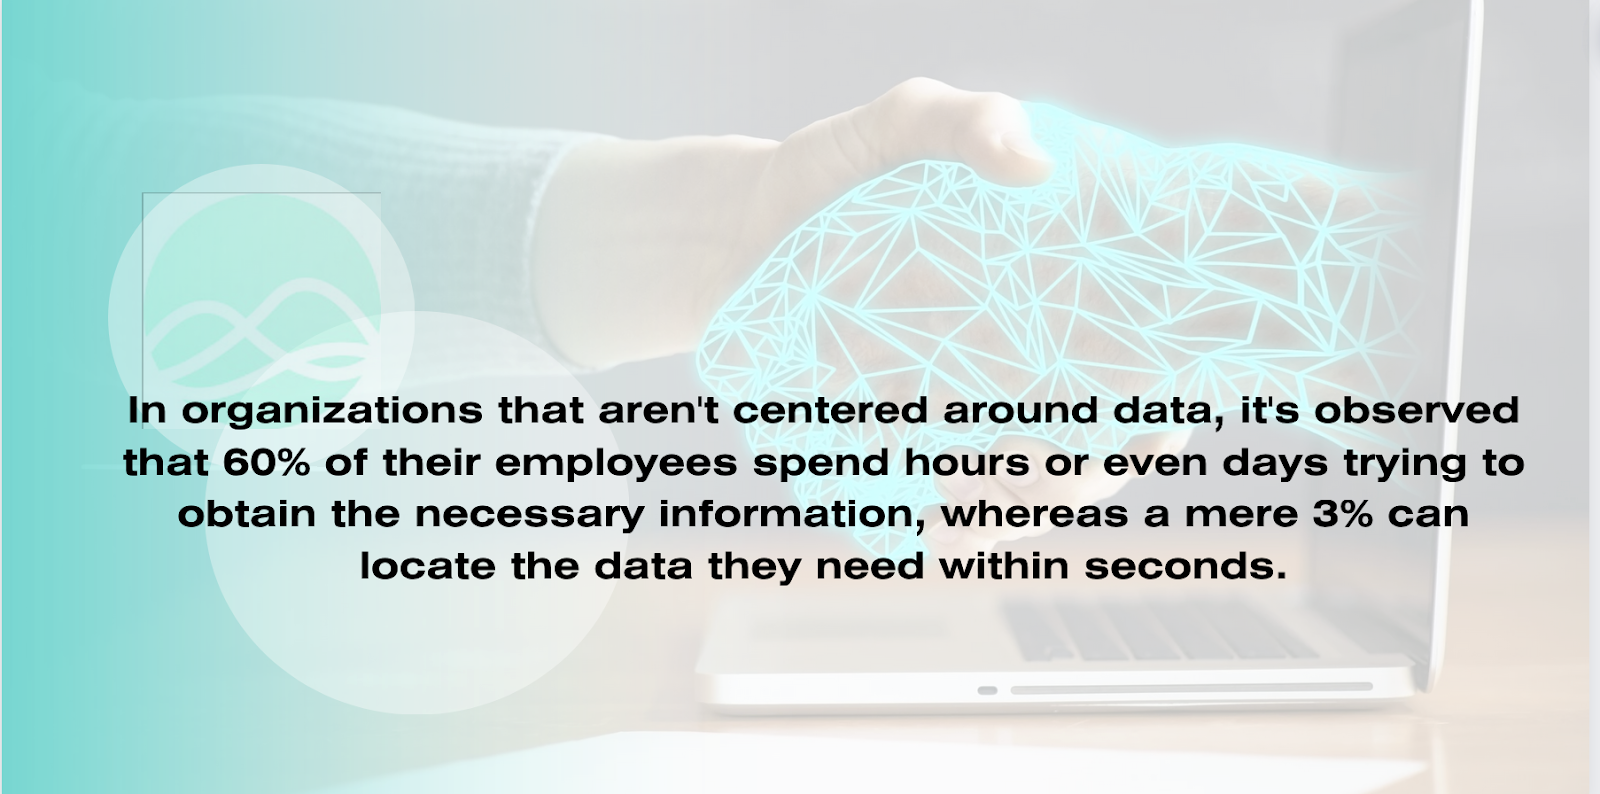
Self-service BI reporting, at its core, is about putting the power of data back into the hands of everyday business users. In a business landscape dominated by ever-evolving digital tools, the value of immediate, personalized, and accurate data analytics cannot be overstated. It addresses the challenge many companies face in harnessing data effectively and has emerged as a prominent trend in the BI and analytics domain.
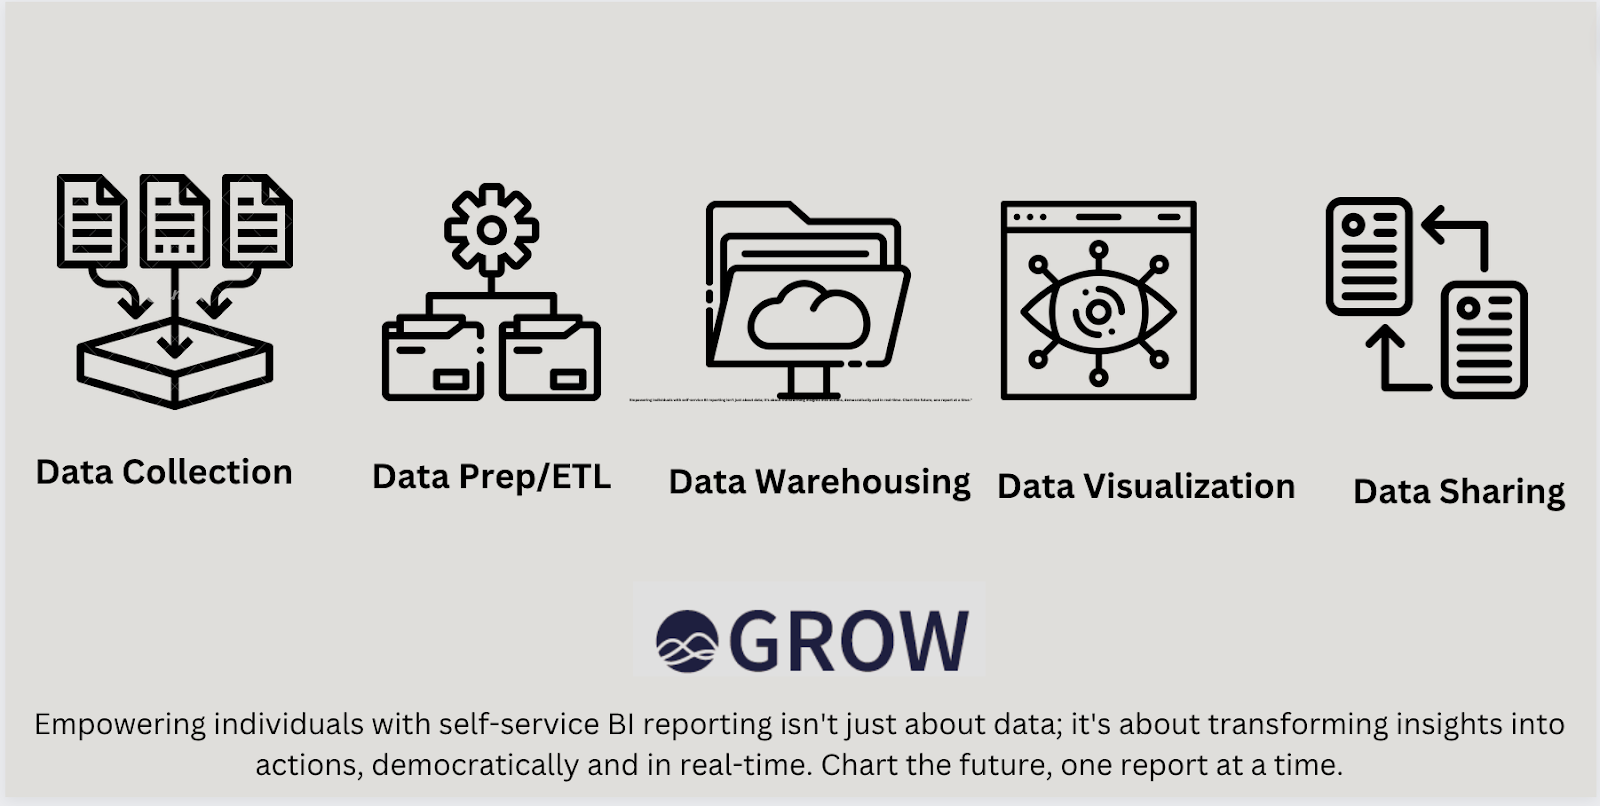
Core Components of Self-Service Reporting
1. Data Integration
- Definition: This refers to the process of collecting, consolidating, and connecting data from disparate sources to provide a unified and cohesive view.
- Importance: As organizations often have data scattered across various platforms, tools, and formats, integration is vital for a holistic view and ensuring accuracy.
- Tools & Technologies: Solutions like ETL (Extract, Transform, Load) tools, data integration platforms, and middleware play a crucial role.
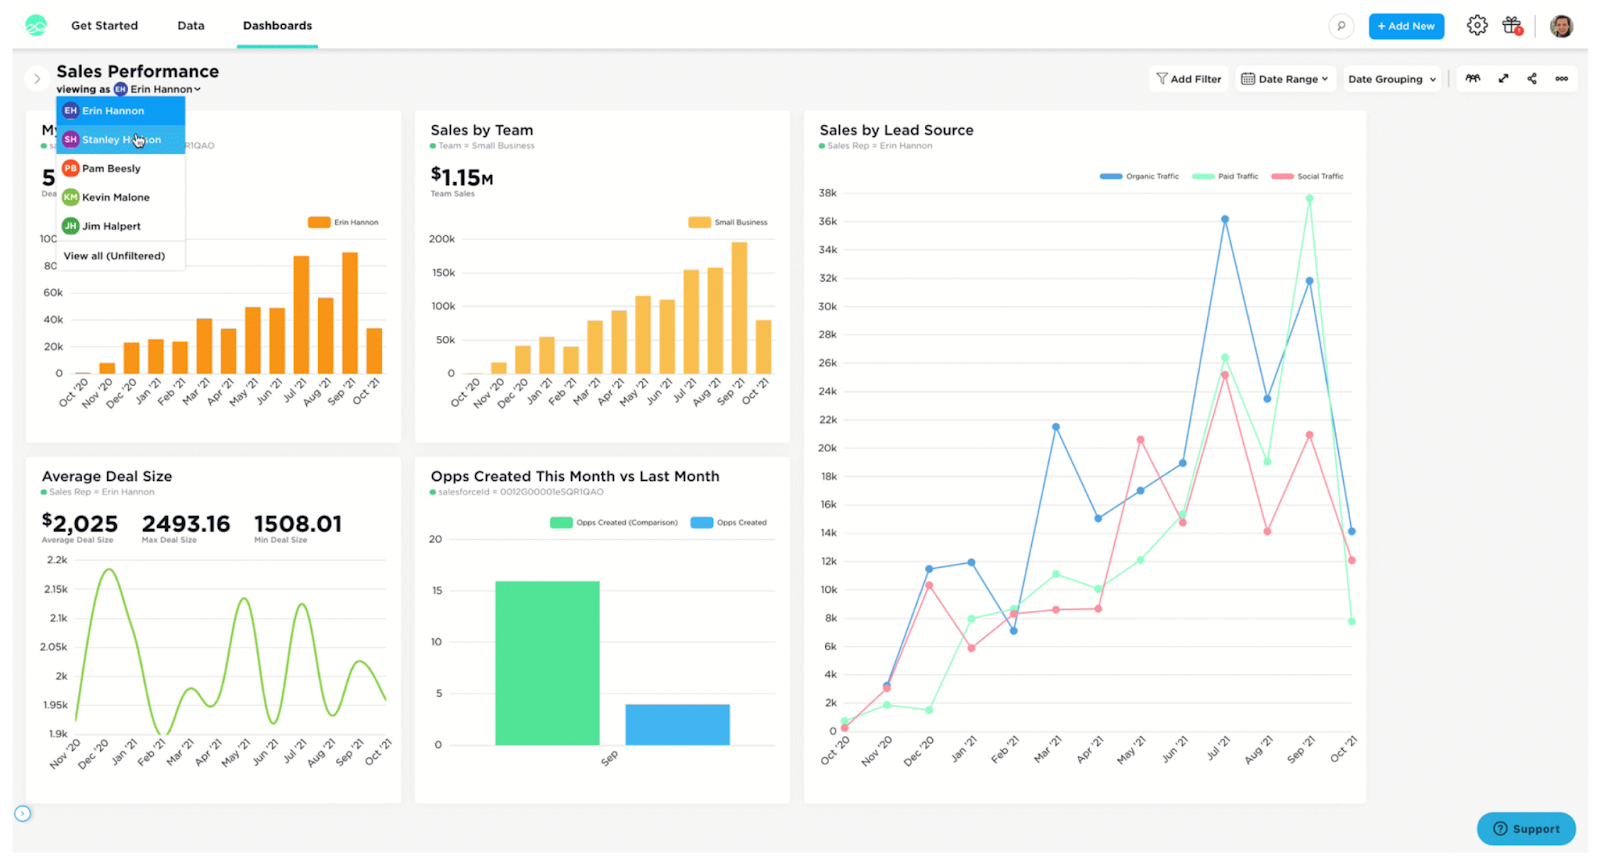
2. Data Visualization Tools
- Definition: These tools transform raw data into visual representations such as charts, graphs, heat maps, and more.
- Importance: Humans are visual creatures. Proper visualization makes complex data more digestible, relatable, and actionable, promoting quicker decision-making.
- Popular Options: With Grow, a leading Business Intelligence tool, users can transform complex datasets into visually appealing and informative charts and graphs, enhancing data comprehension.
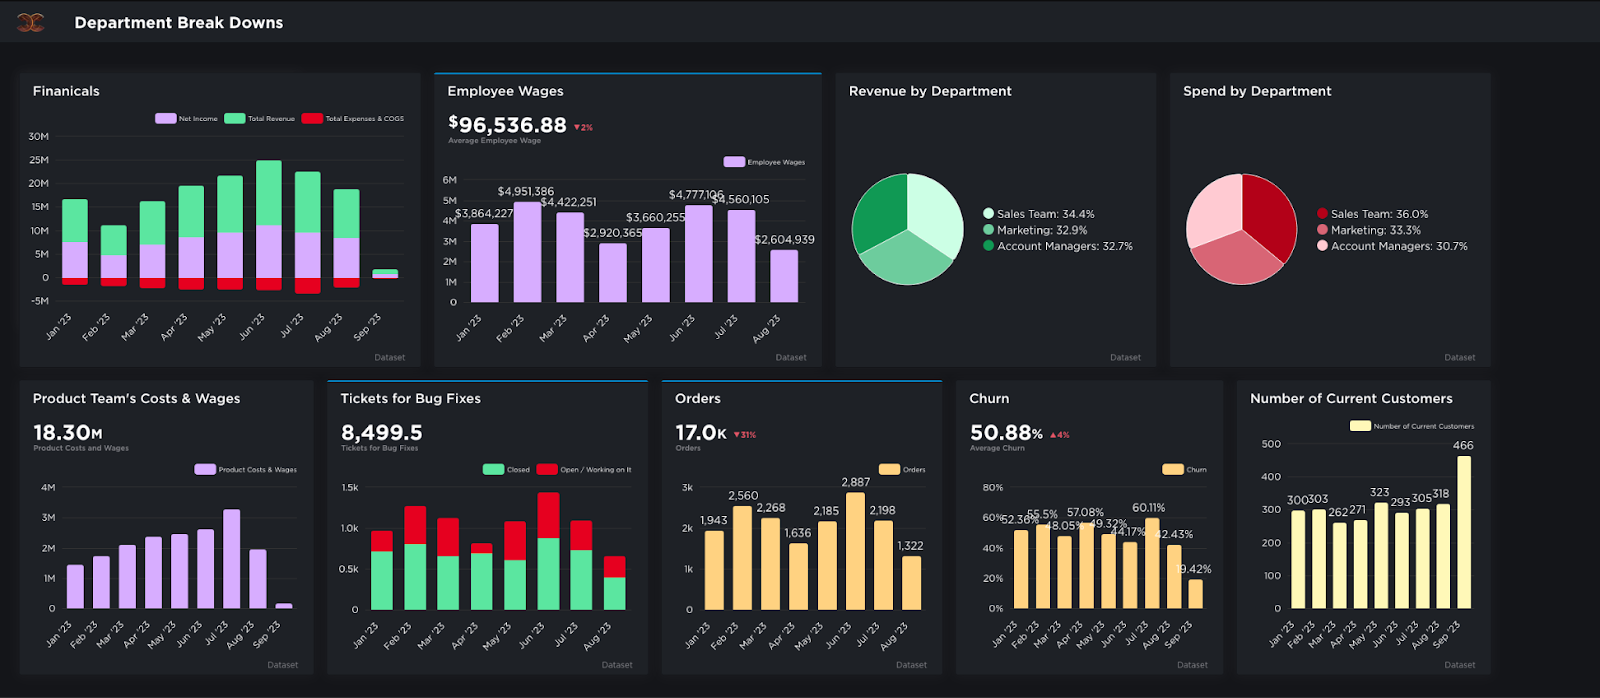
3. Interactive Dashboards
- Definition: Dashboards are consolidated displays of information, typically showcasing key performance indicators (KPIs) and other vital metrics. The 'interactive' component allows users to drill down, filter, or adjust views for more detailed insights.
- Importance: Interactive dashboards enable users to tailor their data exploration according to specific needs, promoting adaptability and deeper analysis.
- Customizability: Advanced self-service BI reporting tools allow users to create bespoke dashboards, reflecting individual or department-specific requirements.
4. Data Exploration & Discovery
- Definition: This component empowers users to dig into datasets, discover patterns, and generate insights without predefined queries or predetermined paths.
- Importance: It promotes curiosity and allows users to identify previously unseen trends, outliers, or relationships in the data.
- Features: Search-driven exploration, pattern detection, and easy querying functionalities, define this component.
5. Data Preparation Tools
- Definition: Before data can be analyzed or visualized, it often needs cleaning, transforming, or enriching. Data preparation tools facilitate this.
- Importance: Clean and well-prepared data ensures accuracy in reporting and analytics. It eliminates inconsistencies, duplicates, and errors.
- Capabilities: These tools offer functionalities like data profiling, cleansing, transformation, and enrichment.
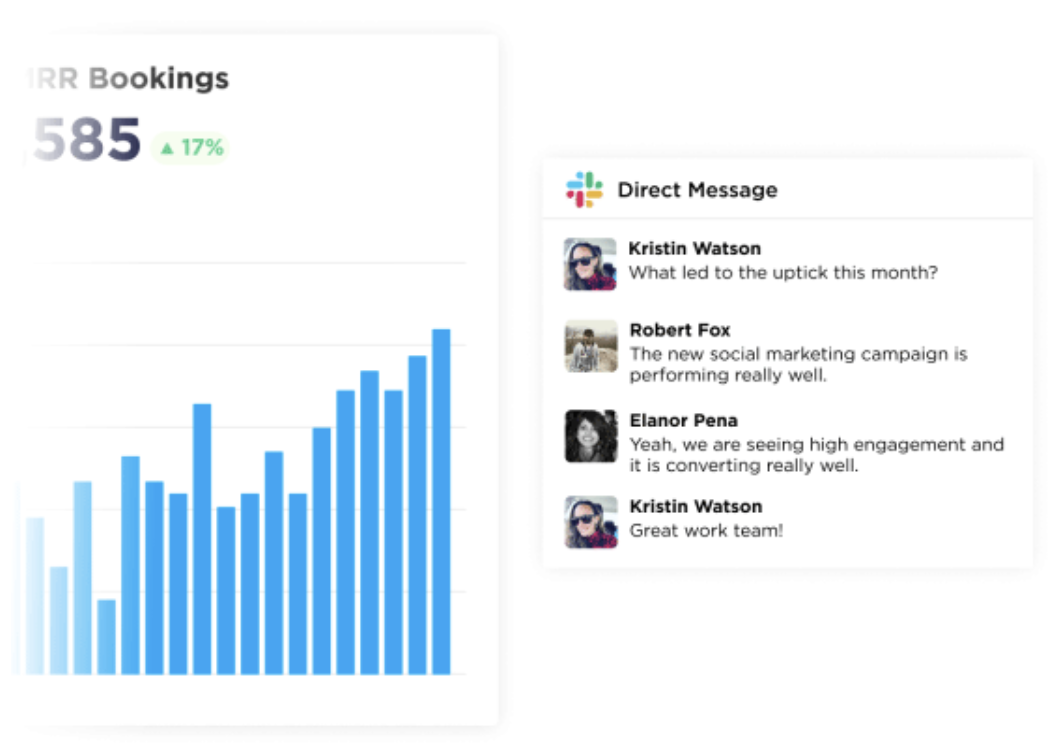
6. Collaboration Features
- Definition: Modern self-service reporting tools often come with features that allow users to share, comment on, or co-create reports and dashboards.
- Importance: Collaboration fosters a collective approach to data-driven decision-making, ensuring diverse viewpoints and expertise are considered.
- Examples: Annotations, shared dashboards, and report commenting are common collaborative features.
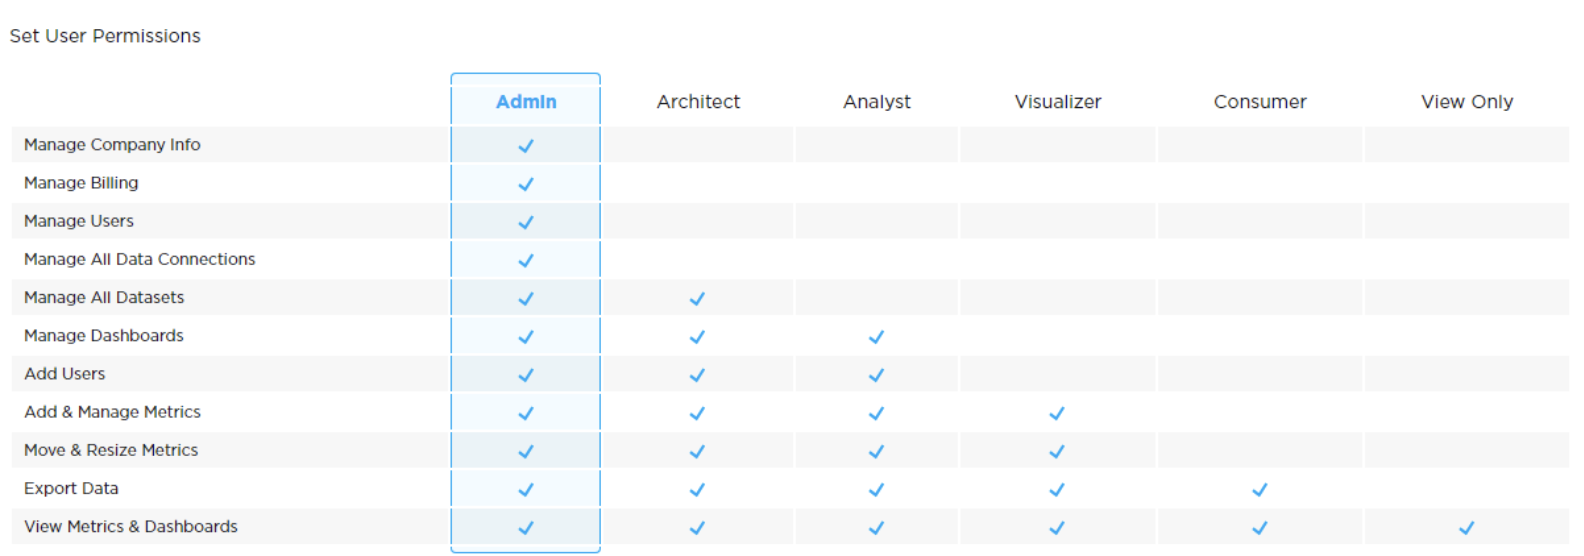
7. Security & Governance
- Definition: While democratizing data is vital, ensuring secure access and maintaining data integrity are equally crucial. Governance structures help set protocols for data access, quality, and usage.
- Importance: It ensures that while data is accessible, it remains protected, and its integrity is not compromised.
- Features: Role-based access, audit trails, data masking, and encryption are components of this pillar.
Benefits of Self-Service Reporting
1. Empowered Decision Making
Managers can independently pull BI reports to understand complex data. Team productivity, sales teams can assess their performance metrics, and executives can view KPIs for strategic decision-making. For instance, a retailer can immediately respond to product sales trends, optimizing stock levels and marketing strategies.
2. Time and Cost Efficiency
Previously, generating a report might have required submitting a request to IT, waiting for processing, and then iterating if adjustments were needed. Now, business units can directly pull the information they need. This not only speeds up operations but also reduces the cost of labor and resource allocation associated with traditional reporting methods.
3. Data Democratization
It just means making data accessible and understandable to non-technical users across an organization.
An R&D team in a pharmaceutical company, for instance, can directly pull and analyze research data, identifying trends or insights that might inform their projects without seeking IT assistance.
4. Increased Flexibility and Customization
Marketing teams can customize dashboards to focus on specific campaign metrics, while finance teams might prioritize budget and expenditure data, all using the same self-service tool.
5. Enhanced Collaboration
In a manufacturing scenario, both the procurement and production teams can collaboratively analyze supply chain data, ensuring timely production while optimizing costs.
6. Proactive Problem Solving
The ability to identify and address issues in real-time based on up-to-date data will always be relevant.
In healthcare, hospital administrators can instantly view patient intake data, helping them allocate resources efficiently during high-intensity periods or emergencies.
7. Reduced Dependency on IT
Self-service reporting lessens the burden on IT departments for report generation and minor data queries. With Business Intelligence services like Grow, IT teams can focus on more strategic projects and technical challenges, increasing overall organizational efficiency.
8. Scalability and Growth
The ability of the reporting system to grow and adapt as the business expands or changes plays an important role. Start-ups or SMEs can start with basic self-service reporting features and then scale up to more complex analytics as their data and business needs grow.
9. Enhanced Data Literacy
As more employees engage with data directly, they better grasp its significance, leading to an organization-wide appreciation for data-driven insights.
Addressing Common Concerns with Self-Service BI
1. Data Security
- Concern: Giving more users access to data can risk breaches or misuse.
- Resolution: Implement robust role-based access controls, ensuring that users only access data they're authorized to see. Additionally, use encryption, audit trails, and regular security assessments.
2. Data Quality and Accuracy
- Concern: Without centralized control, data might become inconsistent or inaccurate.
- Resolution: Establish data governance policies and utilize data quality tools that check, validate, and clean data regularly. Also, encourage a culture of data responsibility among users.
3. Complexity for End-Users
- Concern: Non-technical users might find BI tools too complex, leading to underutilization.
- Resolution: Choose BI tools with intuitive interfaces, provide regular training sessions, and create a central repository of tutorials and FAQs for users.
4. Overdependence on Self-Service
- Concern: Over-reliance on self-service might sideline IT departments or undervalue their expertise.
- Resolution: Establish a collaborative model where IT works with business users, offering guidance and support. Position IT as enablers and not just gatekeepers of data.
5. Infrastructure Costs
- Concern: Integrating new tools might demand significant infrastructural changes or investments.
- Resolution: Opt for scalable BI solutions, potentially cloud-based, that can grow with the organization's needs. Assess ROI by considering time saved and the value of faster decision-making.
6. Resistance to Change
- Concern: Employees might resist the transition to a new system or methodology.
- Resolution: Foster a culture of continuous learning. Highlight the benefits, provide ample training, and consider appointing BI champions in departments to drive adoption.
7. Fragmented Insights
- Concern: Different teams might produce varied reports, leading to fragmented or conflicting insights.
- Resolution: Create a centralized dashboard or repository where standardized reports and insights can be shared, ensuring consistency across the organization.
Conclusion
Unlocking the best in BI just got easier. Using insights from "Grow Cost & Reviews Capterra," we unravel what sets Grow apart in this crowded space. From foundational know-how to advanced techniques, embark on a journey that promises clarity, confidence, and a taste of Grow's distinct edge. If you're keen on turning data whispers into roaring strategies, this guide is your golden ticket.
Dive in our 14-day free demo and let Grow show you the way!


